
Vendor and distribution dependent mortality after COVID 19 jabs
In the dataset of Czech health insurance company (CPZP) can be identified 263 vaccination scenarios by distribution codes (meaning just vendor and distribution, not a lot) some of them very deadly.

בס”ד
(short presentation in English)
(Hebrew)
While people literally went to the market with their skin, voluntarily or by force and for free, pharmaceutical companies made unprecedented profits on taxpayers' expense. It is probably difficult for anyone to defend this as science now. Hardly anyone can defend that now for him to defend it at all now.
The purpose of this work is not scientific, but rather human and meta scientific. In recent years, people have received various injections from various manufacturers in the largest experiment in the history of mankind, and it was also happening in the Czech Republic right in front of all of us. The irrationality of this activity was such that some received even three doses of adenovirus contrary to the manufacturer's intention.
People in Czech republic are mostly timid and shy when it comes to meeting officers, most won't tell anyone how they felt after each dose. Thanks to Mainstream podcast, Angelika Bazalová and Petr Šourek, we have obtained data from some of the smaller health insurance companies in Czech Republic. This document utilizes CPZP insurance company data provided via FOIA. Each row in the dataset shows the week of the year of the insured person (tyden_narozeni), gender (POHLAVI, M means man, Z means woman) and than (if applicable) the week of the year of vaccination by the first dose (vakcina1_tyden), the distribution code (vakcina1_kod) of the vendor according to the following table, the same applies for three following doses. The fifth dose columns just repeat the previous two coluns of the dose four (Yes, let us not speculate why). The last column states week of passing (tyden_umrti), if the man or woman has passed.
Table of distribution codes
99930 (VZP) COVID-19 - OČKOVÁNÍ - BIONTECH/PFIZER
99931 (VZP) COVID-19 - OČKOVÁNÍ - MODERNA
99932 (VZP) COVID-19 - OČKOVÁNÍ - ASTRAZENECA
99933 (VZP) COVID-19 - OČKOVÁNÍ - JOHNSON & JOHNSON
99934 (VZP) COVID-19 - OČKOVÁNÍ - CUREVAC
99935 (VZP) COVID-19 - OČKOVÁNÍ - NOVAVAX
99936 (VZP) COVID-19 - OČKOVÁNÍ - BIONTECH/PFIZER - SPOLEČNÝ DISTRIBUTOR
99937 (VZP) COVID-19 - OČKOVÁNÍ - MODERNA - SPOLEČNÝ DISTRIBUTOR
99938 (VZP) COVID-19 - OČKOVÁNÍ - ASTRAZENECA - SPOLEČNÝ DISTRIBUTOR
99939 (VZP) COVID-19 - OČKOVÁNÍ - JOHNSON & JOHNSON - SPOLEČNÝ DISTRIBUTOR
99940 (VZP) COVID-19 - OČKOVÁNÍ - BIONTECH/PFIZER - DĚTI 5 - 11 LET - SPOLEČNÝ DISTRIBUTOR
The dataset is downloadable at: https://drive.google.com/file/d/1SiM6XgCQLNriVVlmF5S_Jjf8l78ADK6N/view?usp=drive_link )
The vaccine is primarily a test of the patient's condition. If he couldn't even walk to get vaccinated, or if he gave the doctor the impression that the vaccine would kill him, he wouldn't get vaccinated. If he needed that vaccine for travel or work, as incredible as it sounds, since even a biblical slave was allowed to work without life-threatening intervention, he had all the more reason to go get it. This not only led to a healthy vaccinee effect, but also led to variously desperate vaccination schemes better or worse captured in the data.
The HVE or healthy vaccinee effect all ages - the oldest vaccinated people have demonstrated excellent health for their age and have (retrospectively) up to six times higher chance of survival.
For some young ages, the vaccinated (again in retrospect) had a greater chance of dying.
Blue unvaccinated, red vaccinated, yellow the ratio of the chances of survival of an individual (in retrospect) from the vaccinated population compared to the chance of survival of an individual from the unvaccinated population. In the years 2002, 2005 and 2008, it is „better now“ to be „unvaccinated.“
The data captures 259 vaccination scenarios by distribution codes that some people survived to the end of the available data. There are also four scenarios where the user did not survive. There belong some schemes containing three AstraZeneca adenovirus vaccines (not every use of three doses resulted in death), but strangely enough also the combination of mRNA, Jcovden, mRNA. Since someone has already tried these variations on some people, it would probably be desirable for future generations to know what exactly was the result of such a trial. In these cases, it is not possible to conclude from the data itself whether it is a causal effect or a mere coincidence. A careful pathologist could reveal this.
Just for the next time: Vaccination tourism from one vendor to another still always leaves the user to carry the risk on the market. I hope the reader will forgive me the dark humor. The next time someone thinks of having his brethren injected for the good of the humanity, better make sure in advance that someone will really evaluate the trial and give a detailed and honest report.
Vaccination purists and vaccination tourists
To get a sense of what the data is showing, we'll start with the vaccine purists who started with one vendor and stuck with it, stayed faithful to the vendor and never switched to another. We will also only cover in this chapter those born in 1957 and younger to avoid age discrimination of individual vaccines. That leaves us with half a million vaccine purists of Pfizer/Biontech followed by much smaller cohorts of purists Moderna, J&J and AstraZeneca and the smallest Novavax, which was just under seven hundred in the group and had three deceased people in their sixties twenty or more weeks apart. Nothing unusual so far.
The Astra trials
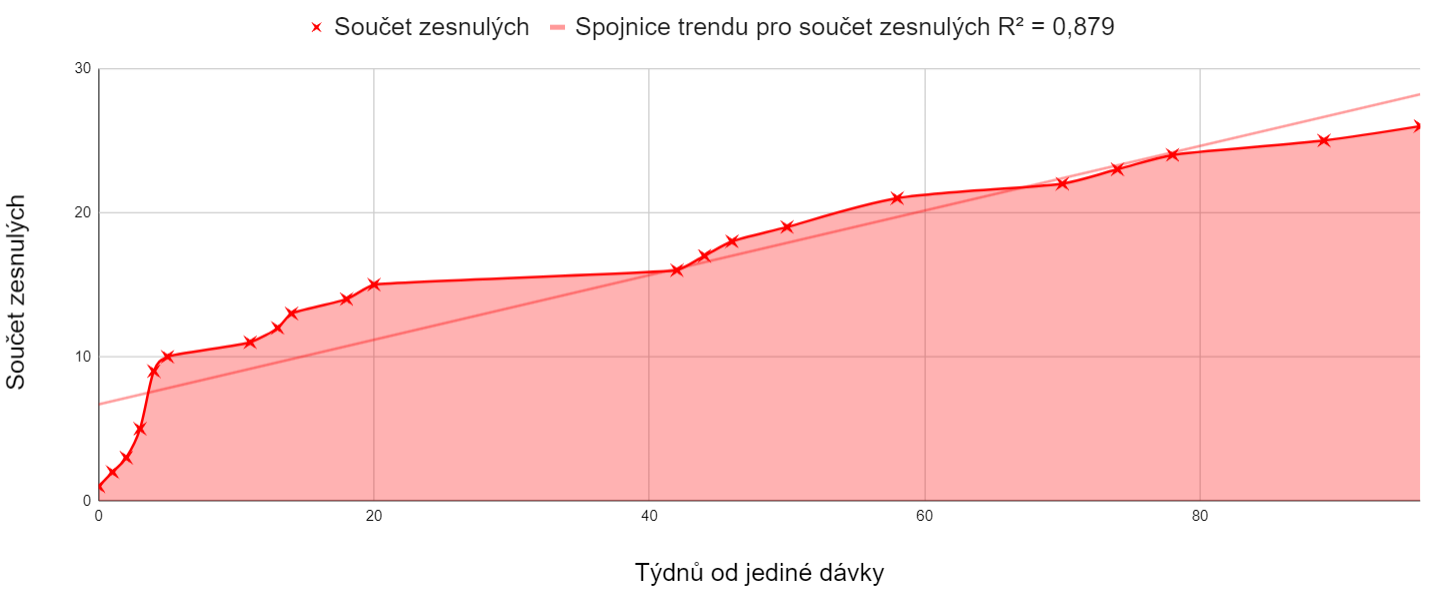
There were only about a thousand purists with a single Astra who did not continue with a second dose in the dataset. If we select from them the years 1957 and younger, of which there were 430, their deaths in time after the first dose give the following graph.
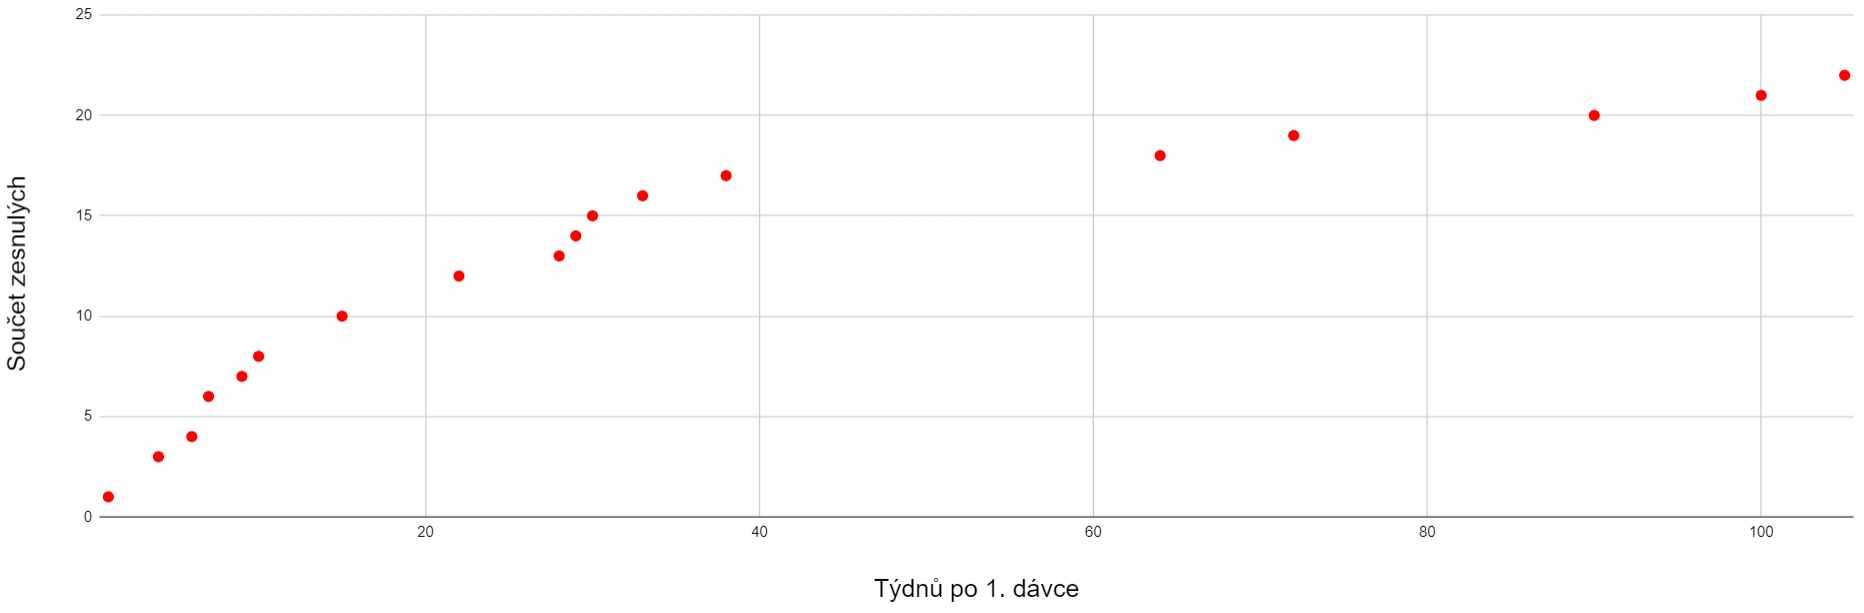
The horizontal axis are the weeks relative to the first and only dose, the vertical axis shows the death count. Just imagine this was a clinical trial.
The graph can clearly be divided into the first period up to week 38 with 17 deaths, followed by the next 60 weeks, in which only five deaths occur. Of course, such an observational mini-study was not designed to prove anything with absolute certainty, however, when it was de facto conducted, a certain selective pattern can be observed. The classic wrote: "What doesn't kill me makes me stronger." But in this situation it would be more appropriate to say: "What doesn't kill you shows your resilience." If the vaccine does no harm, the deaths should not be tied to the weeks after its administration, but rather should distributed evenly over a period of one hundred weeks. However, when we draw a linear trend onto the death count graph, the graph does not correspond to it, to put it mildly. Deaths are tied more to the weeks after application. The average age of the deceased was 58.33 years, the median was 60.72 years.
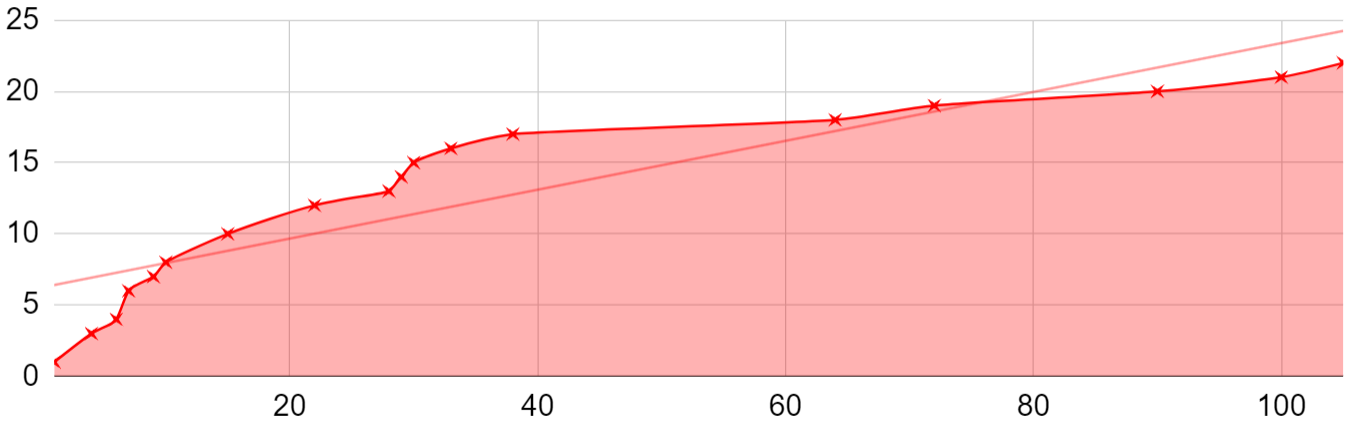
The graph above this time with linear trend to show how uneven distribution of deaths we get.
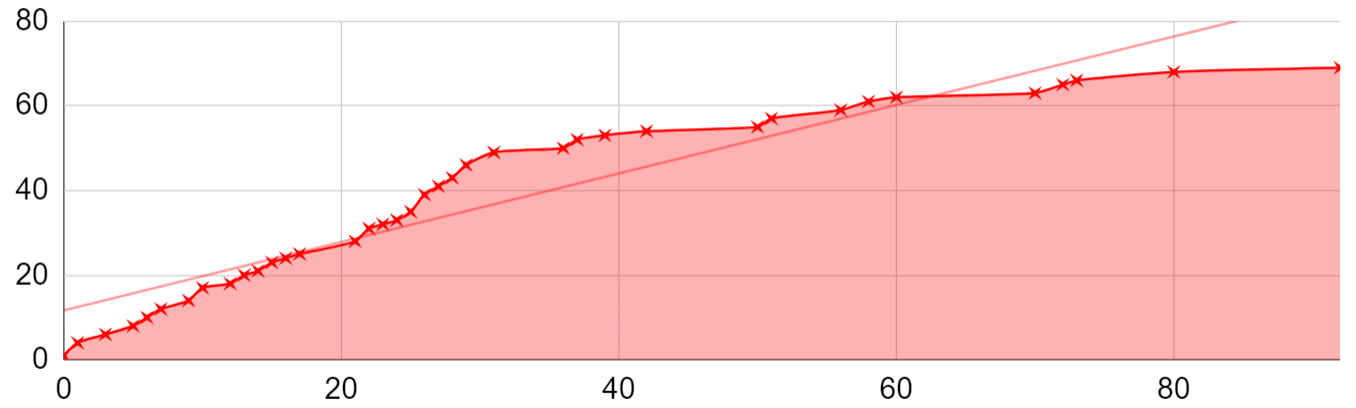
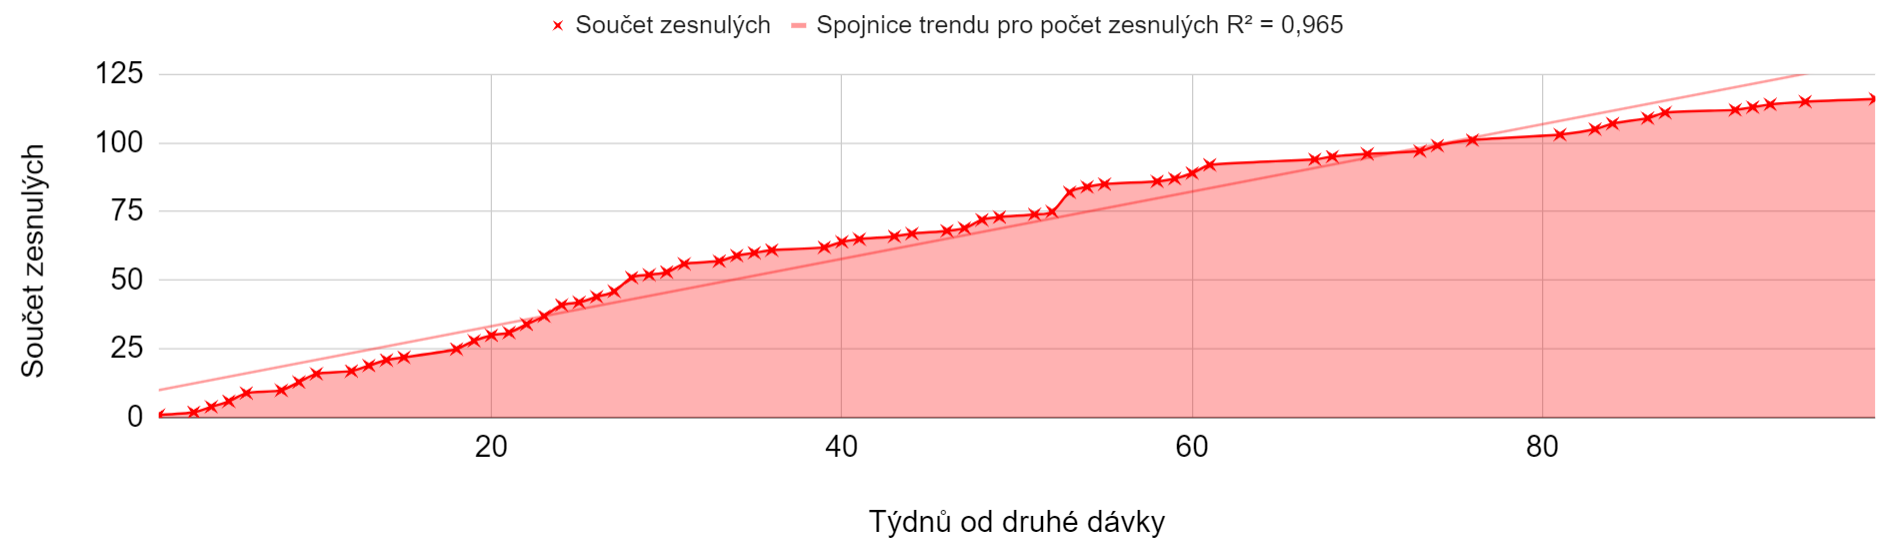
For the 2425 participants who continued exactly with one second dose, a similar pattern applied again. By the 39th week after the second dose, 53 participants died, and in the following year, sixteen of them died. The average age of the deceased was 58.52 years, the median was 60.17 years.
Johnson&Johnson
It should be noted to the credit of this vendor that their product has already been revoked in the United States at their own request. In Europe, to my utter dismay, it was and probably still is temporarilly approved as a two-dose. After reading the EMA materials, it doesn't seem likely to me that anyone thought thoroughly through about the two-dose scheme. The Czech representatives in the EMA commissions, whom I asked if the revocation is pending in Europe as well, did not answer my questions. The vaccine was designed for one dose, it certainly shouldn't have been used for two. The death curve in this mini-study for one dose appears to be linear. 11028 participants born in 1957 and later survive in the data.
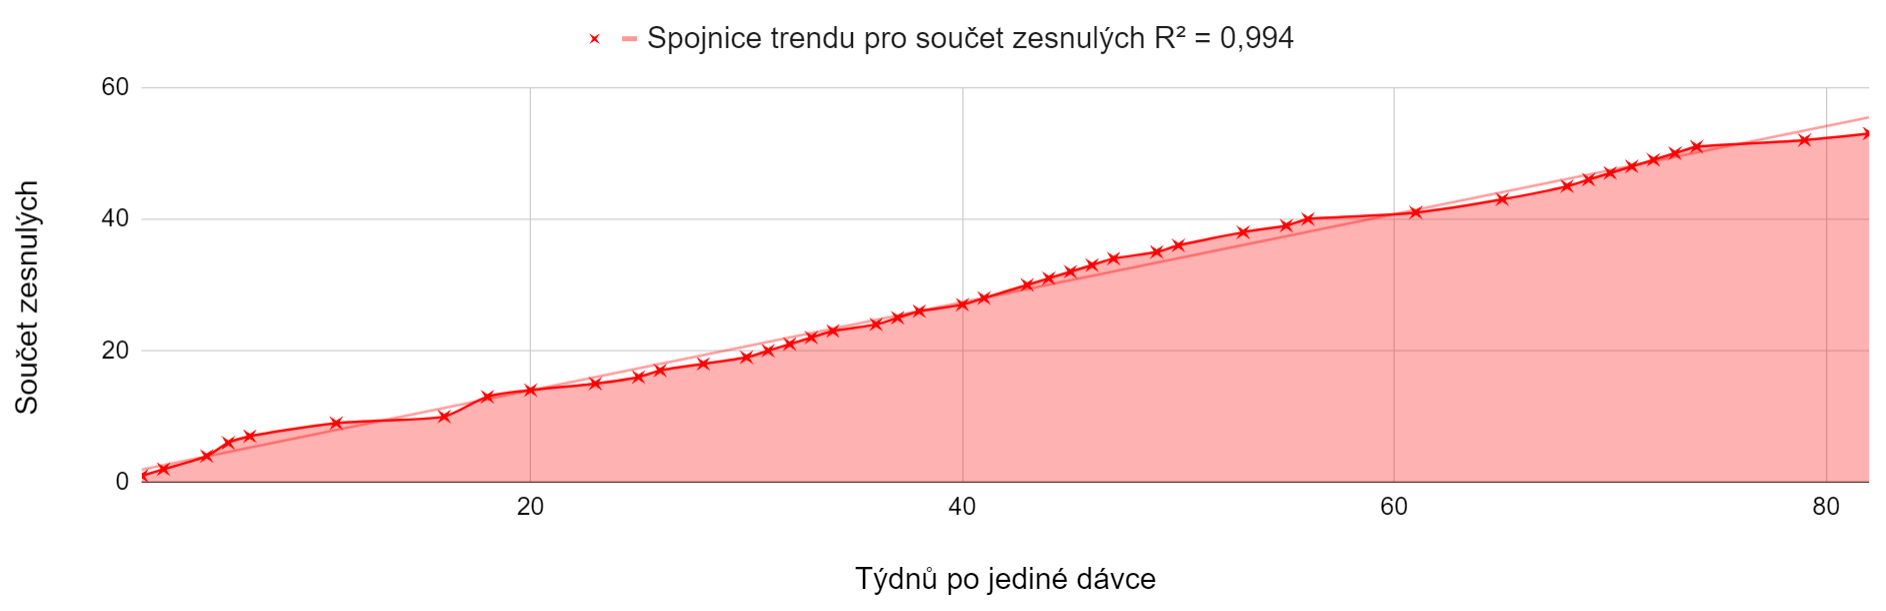
53 participants born 1957 and younger have died. This single-dose vaccine can really demonstrate the real HVE in a given age category. The average age of the deceased was 50.65 years, the median 50.5 years.
Moderna
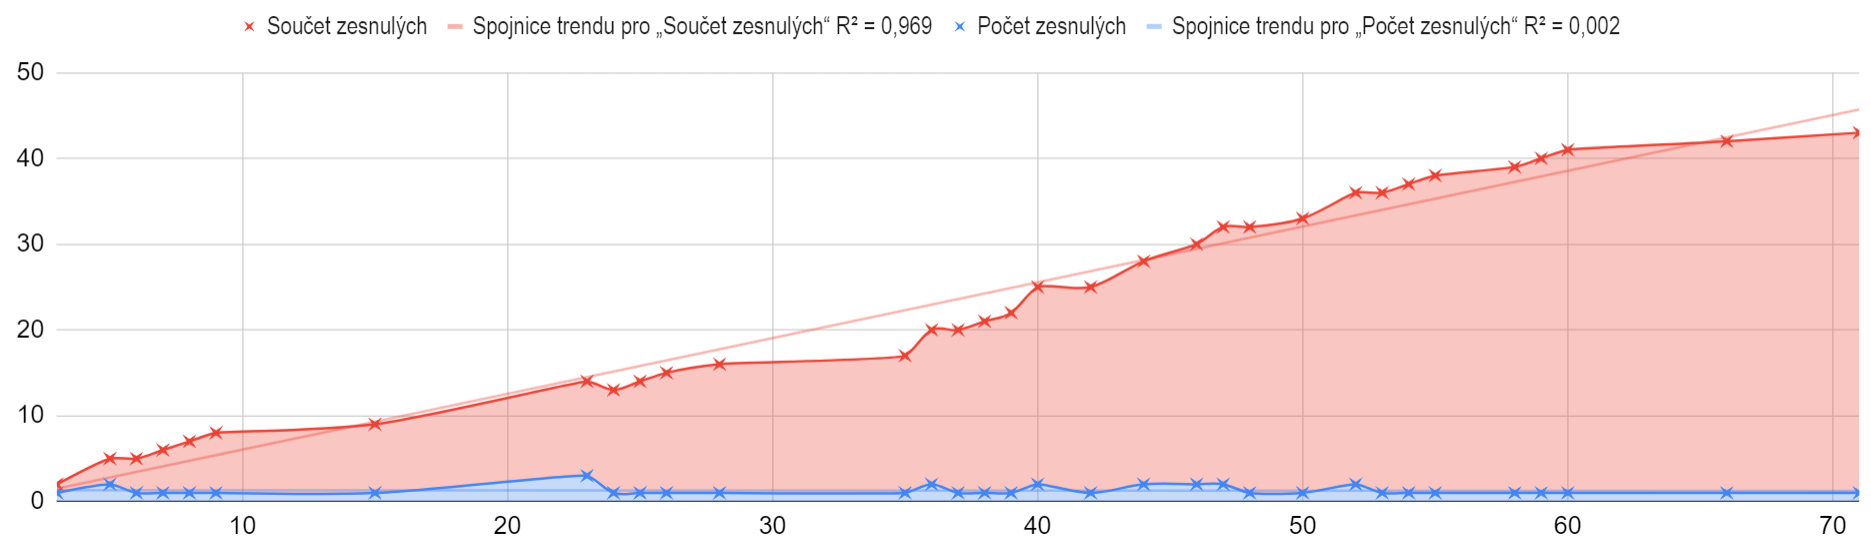
Moderna shows a similar trend as we observed above for Astras. The result of the mini-study is a dataset of 2742 participants of the single dose alive and 27 participants passed after the single dose of those born in 1957 and younger distributed unevenly in time as follows.
There was a similar pattern for the following dose. Each dose was attended by fewer and fewer people. I ask everyone to realize that they could only get the second dose after they have survived the first dose. And it was the same with every other one. It may sound trivial, but please think about the consequences carefully. This explains why fewer and fewer people went to each subsequent dose. If we realize this, but properly, we will be able to perform some experiments in the future only in thought, and not on our own skin.
14759 purists who survived went to get one and only seccond dose, the development of the number of deaths of purists with two doses looked as follows.
The deaths are still unevenly spread in time.
Only 8394 purists went to the third dose not followed by the fourth one, and the distribution of deaths remained uneven, but the participants were already few and there were only 70 weeks available, the mortality did not stabilize.
Only 229 purists who attended the fourth dose, two purists died.
Pfizer Purists
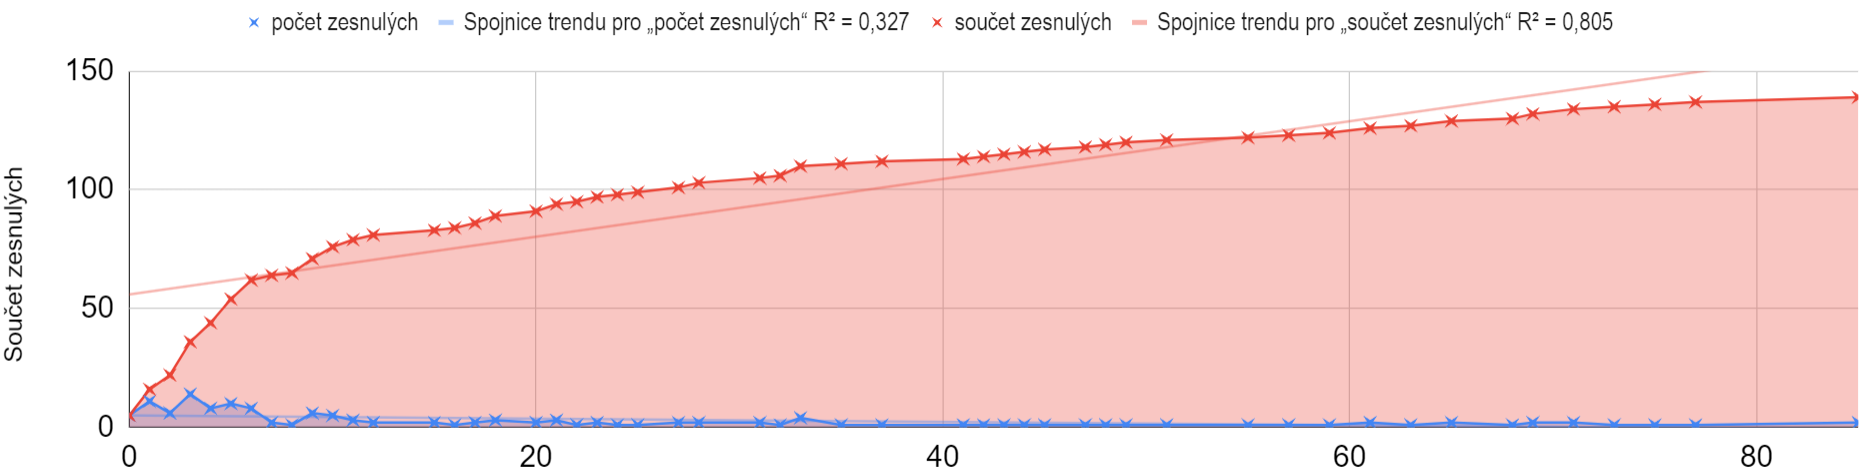
There were 15518 Pfizer purists born in 1957 or younger in the dataset who did not continue to the second dose and survived. It could certainly be argued that these are people, who did not feel well after the first and therefore changed their mind about the second dose. But for me, that's precisely the reason to talk about them. Again, they died much more in the weeks after vaccination than later.
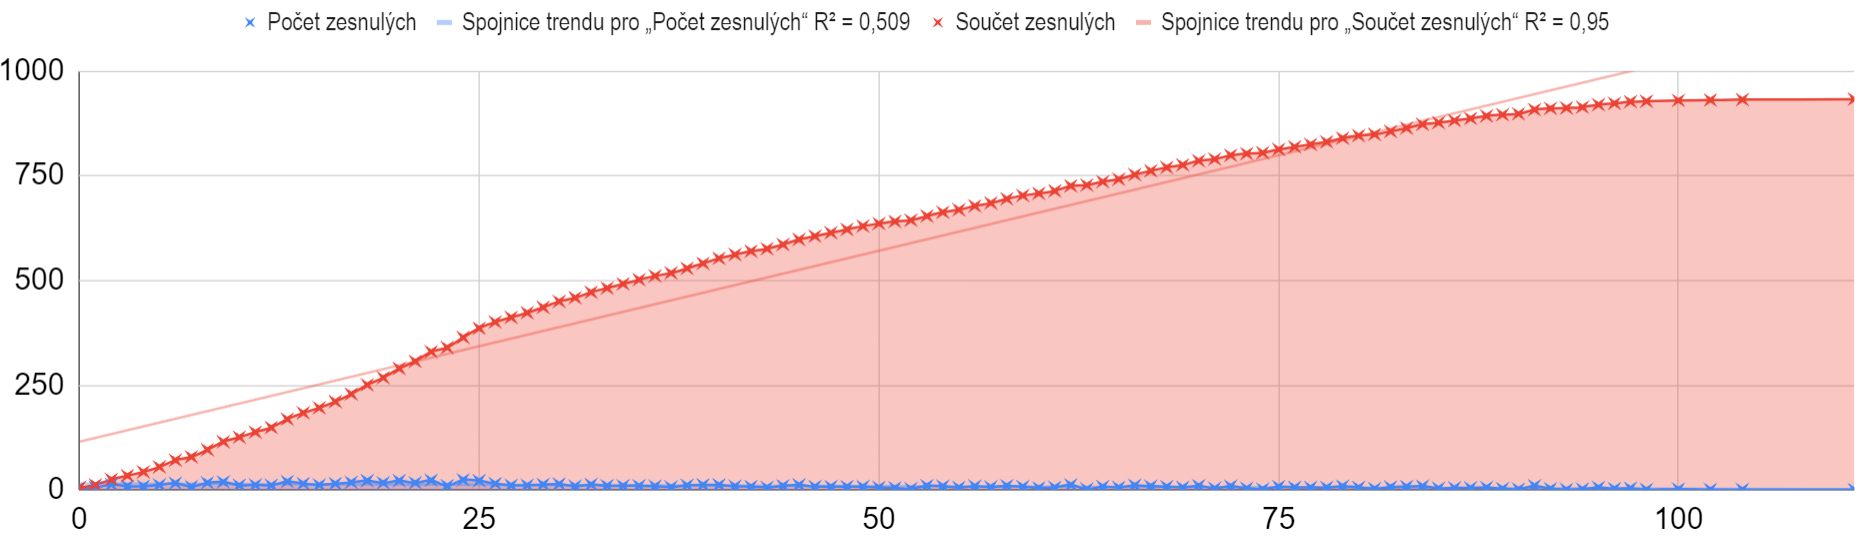
Unsurprisingly, uneven distribution appeared once again after the second dose. 227053 people born in 1957 and younger who survived, and 933 people who did not, used exactly two doses. The average age of the deceased was 54.5 years, median 57.81 years.
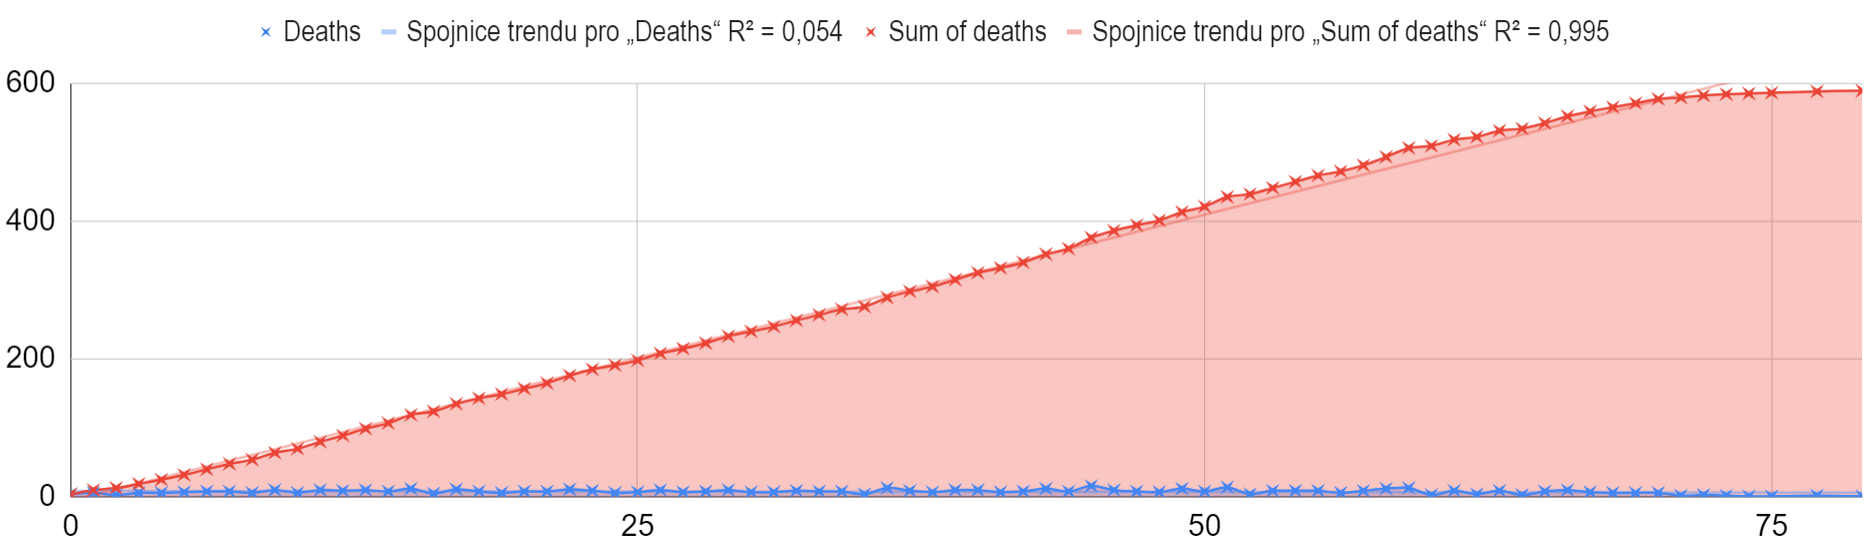
The third and fourth dose are ongoing events. There were 215,009 people born in 1957 and younger who survived till the end of the dataset and only 589 people who did not. It seems that the population that tolerates the doses better did participate in the third dose. The average age of the deceased was 56.58 years, the median 56.27 years.
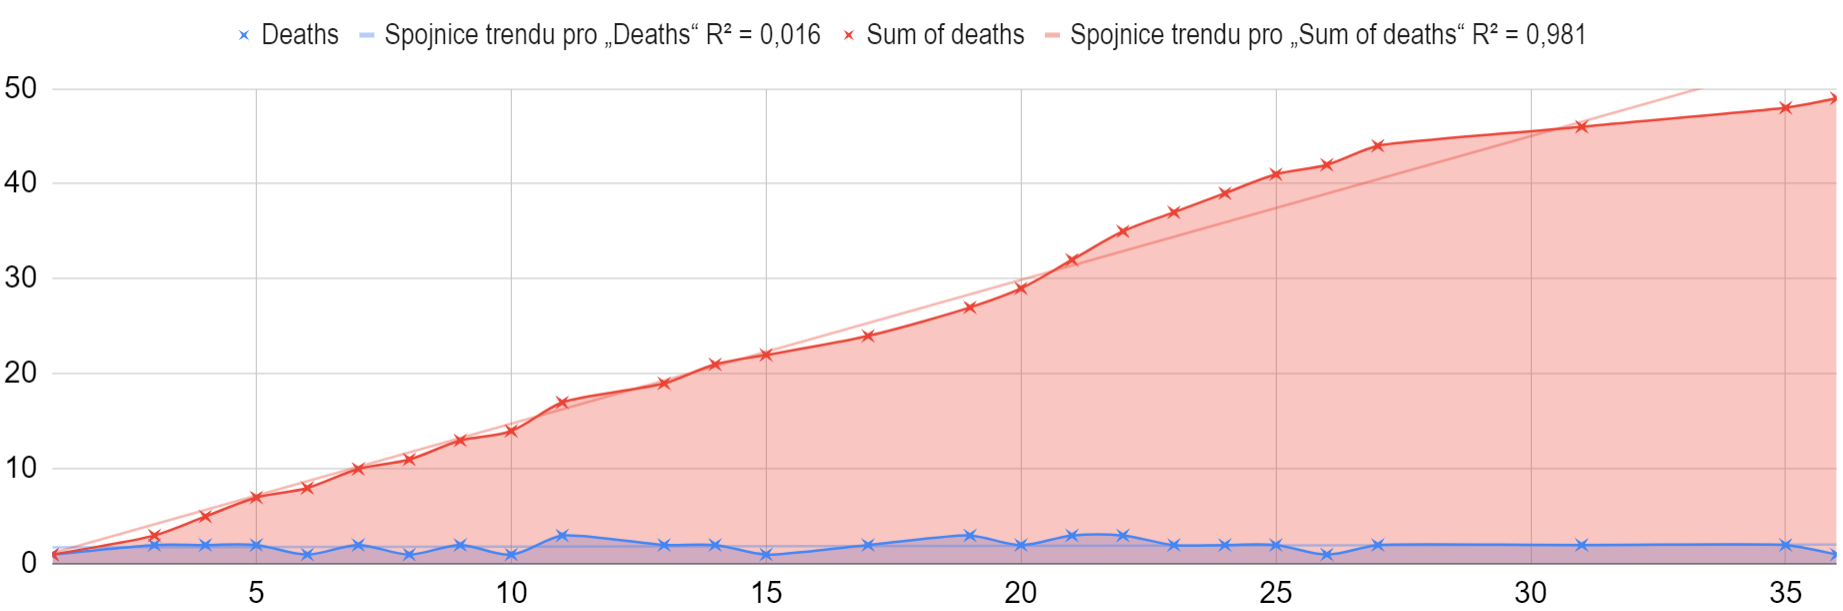
16,688 survived and 49 died after the fourth dose, but there are only 35 weeks available in the data-set.
It would be appropriate to go through the population of vaccination tourists, hopefully I will do so in a separate document.
Truncated data?
Criticism has been raised about the above graphs that the data are skewed, namely that part of the non-linearity or even the whole non-linearity of the increase in the deathcount over time is not caused by the damage to the group by medical intervention, but by the fact that people keep coming to the first dose with a delay and keep increasing dead at the beginning of the graph, while towards the end of the graph they could no longer be added because not enough time had passed since the dose to the data deadline.
For this reason, we will look at how the distribution of deaths in absolute weeks looks like and whether there are periods of time when the number of deaths remains at some stable level.
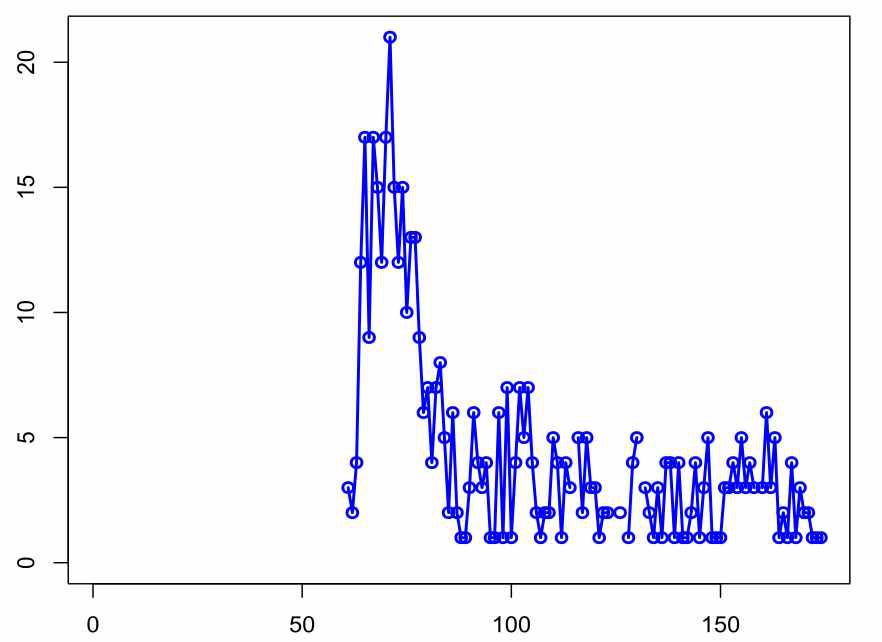
In the following charts are all the deaths of all the vaccination purists. This is to test the theory that the first two doses do have tracable deaths increased for tens of weeks.
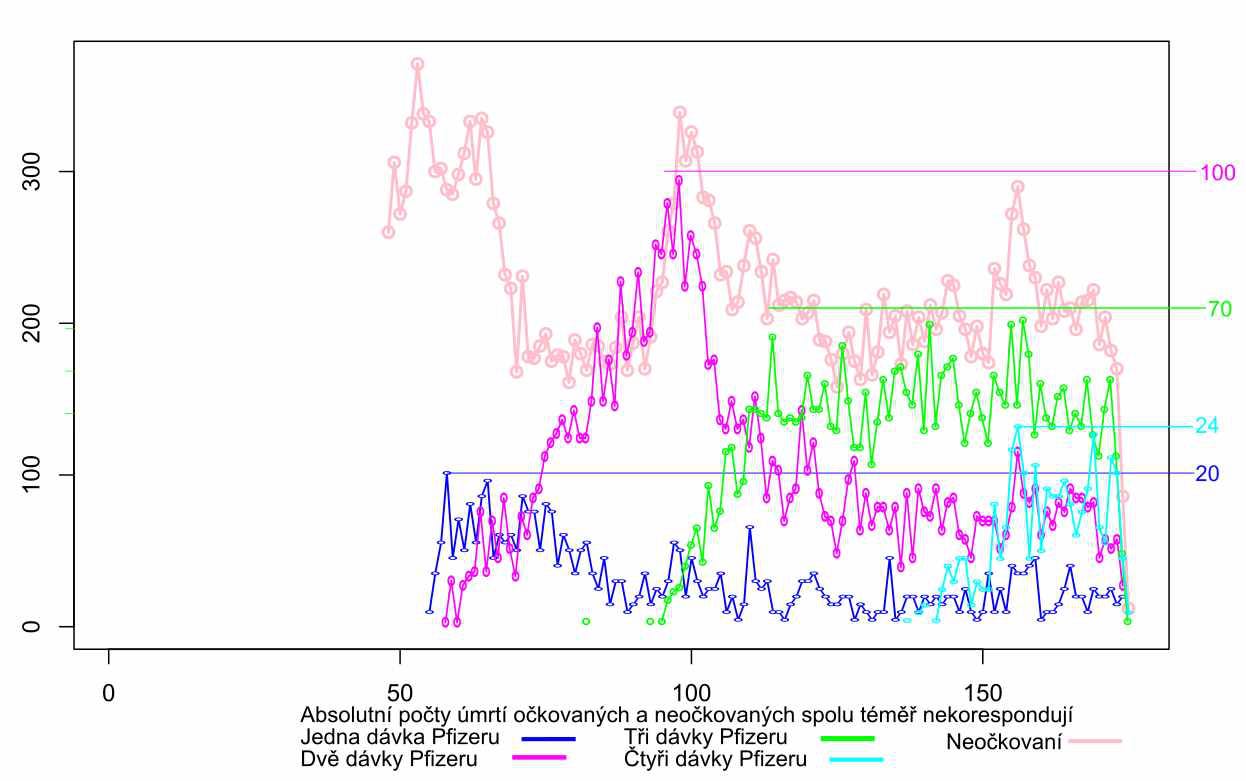
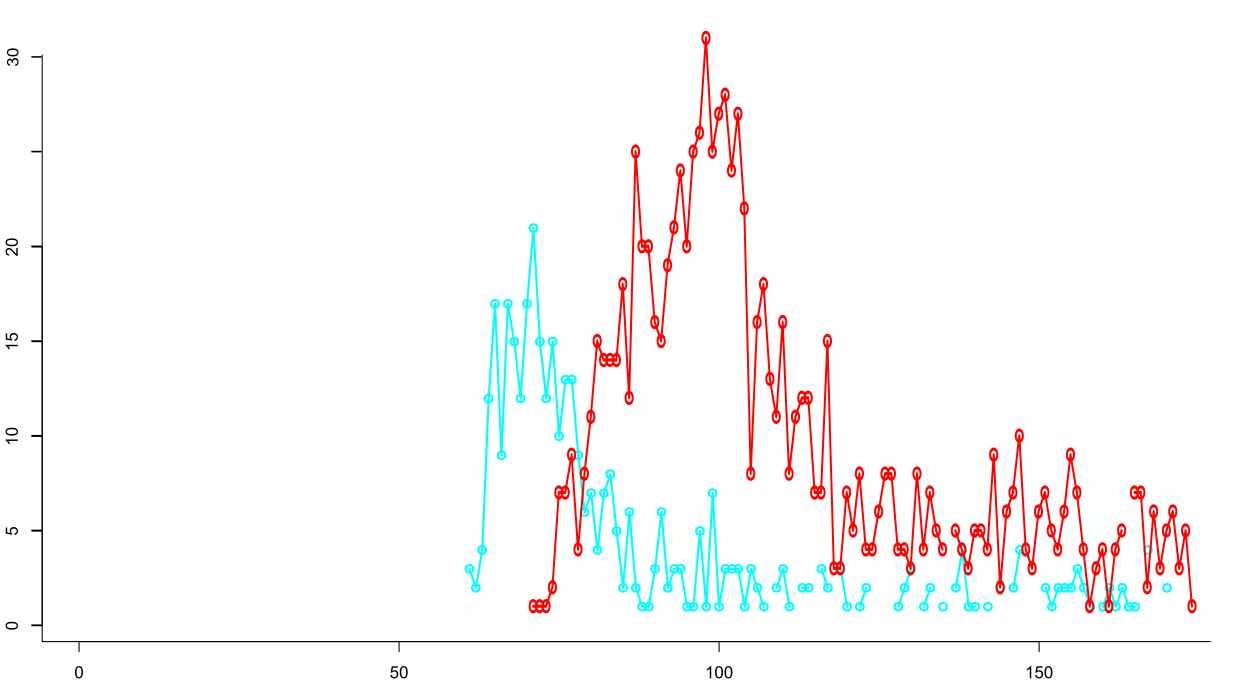
The above graph plots the deaths of not vaccinated (pink) and deaths after Pfizer doses, namely the cassualties after the first and second doses (blue and purple). The third (green) and fourth (turqoise) events are developing events. The maximum number of death cases after the first dose occurs already in the fourth week after the start. The maximum number of death after the second dose does not occur until 39 weeks in. The sums of the dose curves could perhaps reveal other, later maxima, but the organization of the experiment no longer allows us to reveal which intervention could lead to this. Crucially, the intervention was motivated only by the prevention of difficulties with one particular disease, and the moment the post-intervention mortality exceeded a tolerable limit, the population was divided by yet another medical experiment. This process can be repeated always if people agree.
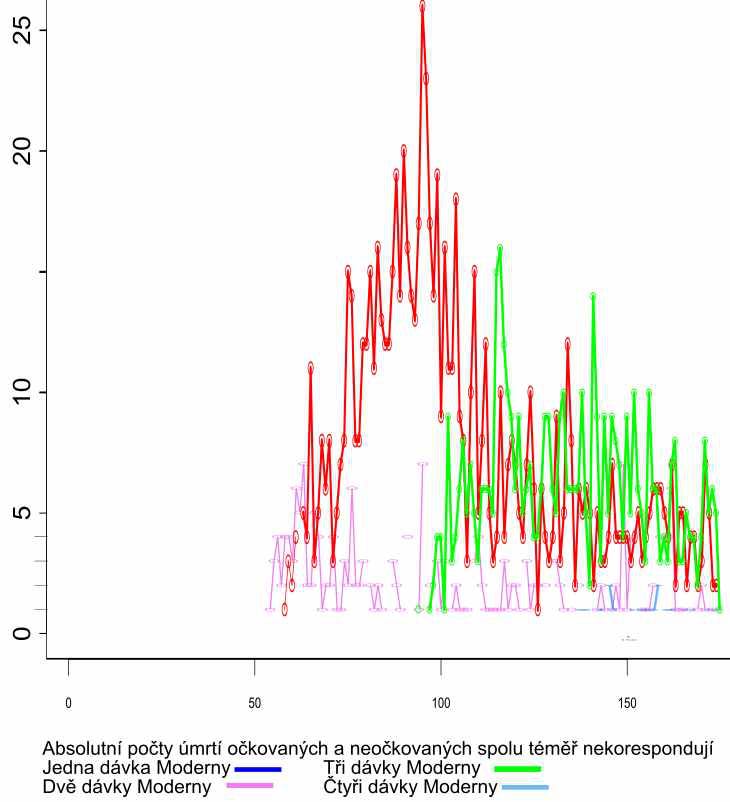
As for Moderna a very similar process takes place, but on a much smaller scale. The graph documents the casualties after the first and second dose (pink and red). The third and fourth doses are developing events. The maximum death after the first dose does not occur until the seventh week after the start. The maximum death after the second dose does not occur until the week 44.
AstraZeneca one dose (turquoise), two doses (red). The unique maximum occurs after ten weeks after the first dose, after 29 weeks after the second dose.
Johnson&Johnson
Deaths are indeed tied to the first batches at the beginning of the campaign, which corresponds to the elimination of the vulnerable population. The maximum occurs nine weeks after the start. However, the statistical signal is lost in the young population.
All the above distributions of deaths for the first two doses (one in Johnson&Johnson case) show a similar pattern, namely accumulation several tens of weeks after the start of application. The population that went to the third and every subsequent dose had already been selected by the previous doses. In these control charts, each population of each vaccination schedule is compared to itself, so there is no need to address its special age composition. Each dose of each scheme chooses its own fitness group and acts on it, therefore the curves look different, but they all show a unique maximum, which, to put it mildly, does not correspond with a beneficial medical intervention. To detect this signal, it would be enough if the population knew each other.
Conclusion
The graphs of death counts after the first two doses of all solutions show that some reduction event or bottleneck even has taken place. The graphs for the 3rd and 4th doses do not show compensation for the bulges of the first two doses. Only the next years will show how big the consequences will be. But the damage is already visible. The reproductive health of men and women will be especially important.
Thank you for reporting.